Problem
Geospatial UI is its own discipline - tile layers, coordinate handling, map-driven state - and most weather apps hide the map behind a search box. This demo makes the map itself the query interface.
What I built
An interactive explorer built on Leaflet:
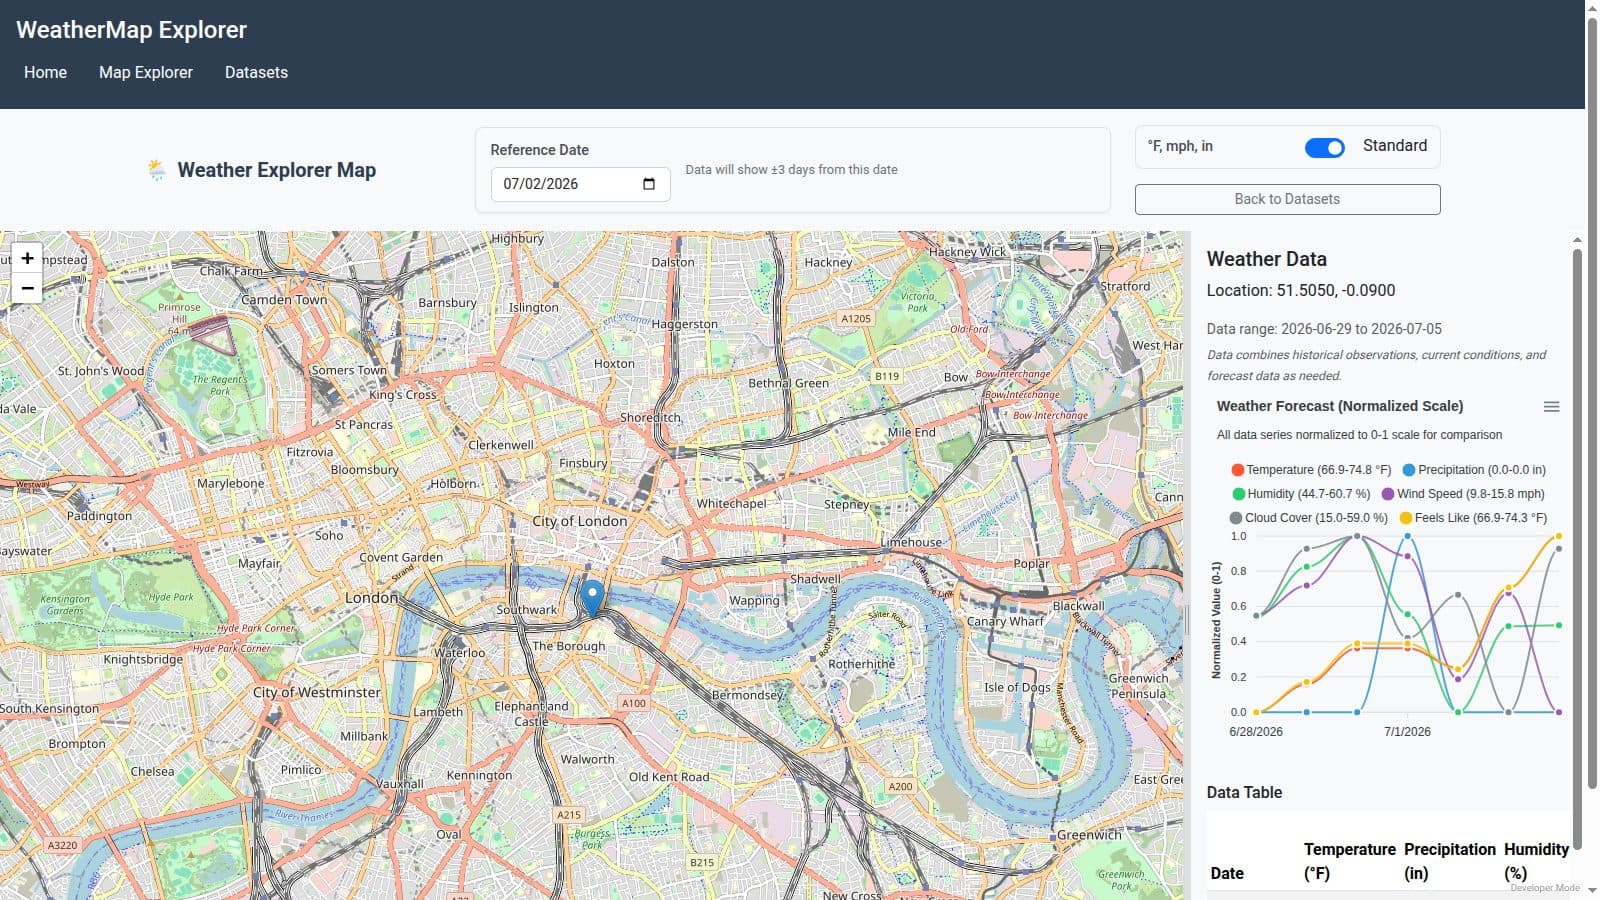
- Map-first querying - click any location; the app reverse-resolves it and fetches weather for those coordinates.
- Charted results - temperature, precipitation, and humidity rendered as a normalized forecast chart alongside a raw data table.
- Reference dates - pick a date to explore data around it, with unit toggling (metric/imperial).
Outcome
A compact demonstration of geospatial data processing and visualization: mapping library integration, third-party weather API orchestration, and chart rendering working together in one flow.